Summary: Most published false positive rates in runtime security can't be verified by the reader: here's how the same soak data produced a 0.00358% rate and 1.3 false positives per pod-hour, and the three things a vendor must publish before you believe either.
I recorded a flattering number. This post is about how I did it, why it was technically true, and why you shouldn't have believed it. Note: this is from an outdated soak test and our FP has improved since then.
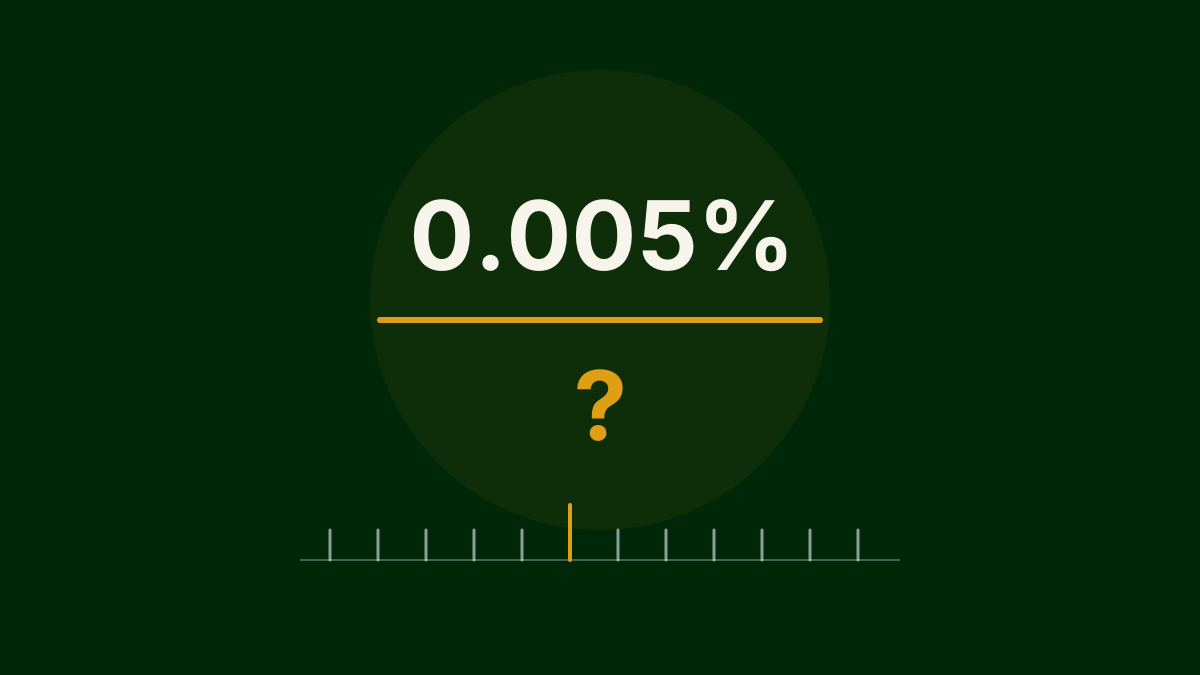
A false positive rate of “sub-0.005%” sounds settled until you ask one question: 0.005% of what? Most FP rates published in runtime security can't be checked by the person reading them. Not because the vendor is lying (the number is usually real) but because a bare percentage is unfalsifiable. There's nothing to audit.
Why a bare rate is unfalsifiable
To verify a rate, you need three things, and vendors almost never publish any of them:
- The denominator. A rate is a fraction. If you don't know what's on the bottom, the top is meaningless. Per what: per alert, per event, per sample, per pod-hour?
- The event definition. What counts as one alert? If a detector fires 40 times in a burst on the same process, is that 40 false positives or one? Deduplication policy alone can move a rate by an order of magnitude.
- The labeling method. Who decided each alert was false, and how? “An analyst reviewed them” is not a method. This is where rates quietly cheat.
Missing any one of these, the rate is marketing. All three present, it's a claim you can argue with.
One dataset, three numbers
Here's the trick with real telemetry from my own soak testing. My detector samples workload behavior 10 times per second, per pod. That's 36,000 samples per pod-hour. In an aggregate run, benign workloads tripped the detector about 1.3 times per pod-hour.
Same data, three honest-sounding headlines:
- 0.00358% false positive rate (per sample)
- 1.3 false positives per pod-hour
- ~31 false positives per pod-day
Every one of these is arithmetically true. One of them sounds like a solved problem. One of them sounds like an alert-fatigue incident waiting to happen. And notice the perverse incentive: sample faster and the per-sample rate improves, while the operator's actual experience (alerts per day) doesn't change at all. You can engineer a better-looking rate without touching the detector.
The denominator that matters is the one an operator lives in: pod-hours. Nobody triages samples. People triage alerts, on shifts, measured in hours.
One rate hides a spread
The aggregate also lies by averaging. In a recent soak across 10 workloads:
- Databases (postgres, redis): 0 false positives
- Web and JVM apps: ~0.11 per pod-hour
- A Go service: ~0.34 per pod-hour
Same detector, same run, a 3x spread between the noisiest workload classes and dead silence from the databases. If your fleet is mostly postgres, my honest average overstates your pain. If you run JIT-heavy JVM services, it understates it. An aggregate FP rate tells you almost nothing about your cluster until you know the workload mix behind it.
The labeling trick
The part nobody talks about: how do you know an alert was false? My answer is a clean soak: a long run with no attacks injected, on known-benign workloads. Under that setup every single trip is, by construction, a false positive. No analyst judgment, no ambiguity, no quiet reclassification of embarrassing alerts as “informational.”
A clean soak buys you honest labels. It's also the harshest possible grading, which is exactly why it's credible.
Rates are fragile, so here's what I'll publish
An FP rate also decays outside its test conditions. How long was the run? A 2-hour demo and a 2,888 pod-hour soak (my longest single run) are not the same evidence. What was running? Ten toy nginx pods behave nothing like a production JVM fleet.
So here's the standard I'm holding myself to, and the one you should demand from anyone who quotes you a rate:
- Denominator: per pod-hour, not per sample
- Event definition: what counts as one alert, including dedup policy
- Labeling method: clean soak, no attacks, every trip counts
- Workload mix: what was actually running, with per-workload breakdown
- Duration: total pod-hours, and whether it's one run or an aggregate across versions
My numbers above: 5,000+ pod-hours aggregate across code versions, longest single run 2,888 pod-hours, all first-hand telemetry.
Next time a vendor hands you a percentage with an impressive number of zeros in it, ask the five questions. If they can't answer, the rate isn't wrong: it's unfalsifiable. Which is worse.